
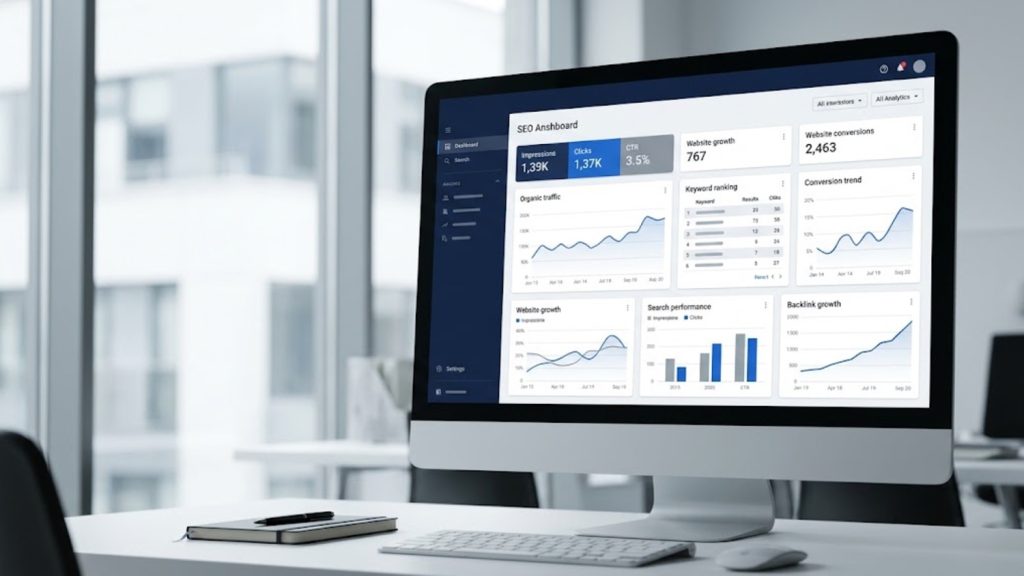
An SEO dashboard report helps website owners and marketers understand how their websites perform in search engines. It brings important measurements, such as organic clicks, search impressions, keyword visibility, landing-page performance, and conversions, into an organized view.
Instead of checking several tools without a clear plan, you can use a dashboard to identify changes, investigate potential problems, and decide which SEO improvements deserve attention.
The most useful report does not simply display numbers. It explains what those numbers mean for your website and helps you choose the next action.
What Is an SEO Dashboard Report?
An SEO dashboard report is a visual summary of selected search engine optimization metrics. It may contain charts, tables, comparisons, and key performance indicators (KPIs) that help users monitor search visibility and website performance over time.
A dashboard can use data from Google Search Console, Google Analytics 4, and third-party SEO platforms. Each source measures different aspects of performance, so the report should clearly identify where each metric comes from.
For example, if search impressions increase but clicks remain relatively stable, your website may be appearing for more queries without attracting a proportional increase in visits. The next step is to investigate the queries, pages, and positions responsible for that change.
SEO Dashboard vs. SEO Report
An SEO dashboard and a written SEO report serve related but different purposes.
| SEO dashboard | Written SEO report |
|---|---|
| Makes ongoing performance monitoring easier | Explains results for a particular reporting period |
| Presents key metrics visually | Provides context, findings, and recommendations |
| Helps identify changes and trends | Documents actions and outcomes |
| Can be updated regularly | Is often prepared weekly or monthly |
A dashboard shows what is happening. A written report helps explain why it matters and what should happen next.
Why Is SEO Dashboard Reporting Important?
SEO involves content development, technical improvements, keyword research, internal linking, and other activities. Without consistent reporting, it can be difficult to understand whether those activities are producing useful results.
A well-organized dashboard helps you:
- Monitor organic search performance over time.
- Identify pages that gain or lose visibility.
- Find queries with potential for improvement.
- Investigate technical or tracking problems.
- Evaluate whether search visitors complete valuable actions.
- Communicate progress to clients, managers, or business owners.
The key is to connect every metric with a question or decision. A dashboard filled with unrelated statistics can be harder to use than a smaller report focused on meaningful outcomes.
Important Metrics to Include in an SEO Dashboard Report
The right metrics depend on your website’s purpose. An informational blog may prioritize search visibility and content performance, while a service business may focus on qualified enquiries and bookings.
1. Organic Search Clicks
Clicks show how often users click through to your website from Google Search results.
Review clicks across important pages and queries to identify content that attracts visitors. A decline may justify investigating search demand, rankings, competing results, technical issues, or recent content changes.
Clicks alone do not explain why performance changed, so examine them alongside other measurements.
2. Search Impressions
Impressions indicate how often your website appears in Google Search under Google’s reporting rules.
An increase can suggest that your content is becoming visible for additional searches. However, more impressions do not automatically mean more qualified visitors.
Review the queries and pages behind the change to determine whether the new visibility matches your intended audience.
3. Click-Through Rate
Click-through rate (CTR) is the percentage of impressions that result in clicks.
The calculation is:
CTR = (Clicks ÷ Impressions) × 100
For example, 150 clicks from 5,000 impressions produce a CTR of 3%.
CTR can help you investigate whether search listings attract attention, but there is no universal ideal percentage. Ranking position, search intent, device, and search-result features all affect the result.
4. Average Search Position
Google Search Console reports average position for your website’s search results. It is an average, not a guarantee that your page will appear at that position for every searcher.
Use it to identify broad changes and investigate important queries. Avoid interpreting a small movement in average position as proof that your entire SEO strategy has succeeded or failed.
Google’s official guide explains clicks, impressions, CTR, and position.
5. Organic Sessions and Engagement
Google Analytics 4 helps you understand what visitors do after arriving at your website.
Depending on your configuration, useful metrics include organic sessions, engagement, landing-page activity, and key events. These measurements provide context that search visibility data alone cannot supply.
Search Console clicks and Analytics sessions are not interchangeable. Differences between them are normal because the platforms measure different events and apply different reporting methods.
6. Conversions and Leads
For many business websites, conversions are more meaningful than traffic alone.
Depending on the business, these may include:
- Completed purchases.
- Qualified contact form submissions.
- Appointment bookings.
- Quote requests.
- Relevant newsletter registrations.
Conversion reporting is only useful when tracking is configured correctly. If important forms or purchases are not recorded, the dashboard may understate the value of organic search.
7. Landing-Page Performance
Landing-page reporting shows which pages attract search visitors and how those pages contribute to your objectives.
Identify pages that are gaining visibility, losing clicks, or attracting visitors who do not take the expected next step.
Before creating a new page for a keyword opportunity, check whether an existing article already serves the same search intent.
8. Backlinks and Technical SEO
Some dashboards also track referring domains, important backlink changes, indexing concerns, crawl errors, or Core Web Vitals.
These indicators can help identify areas for investigation. However, a technical warning or a new backlink does not automatically explain a ranking change.
Include these metrics when they support a specific diagnostic or reporting goal.
How to Create an SEO Dashboard Report
Step 1: Define Your Objectives
Start by deciding what you need the report to answer.
For example:
- Is organic search visibility improving?
- Which pages attract the most relevant visitors?
- Which queries have potential for improvement?
- Are organic visitors generating leads or sales?
- Which technical problems need investigation?
Your answers will determine which metrics belong in the dashboard.
Step 2: Choose the Right Data Sources
Use each platform for the information it measures best.
| Tool | Main purpose |
|---|---|
| Google Search Console | Search clicks, impressions, CTR, queries, and average position |
| Google Analytics 4 | Sessions, engagement, and configured conversions |
| SEO research platforms | Estimated rankings, keyword research, competitor analysis, and backlinks |
| CRM or sales system | Qualified leads, appointments, and sales outcomes |
For an introduction to Google Search reporting, consult the official Search Console performance report guide.
You do not need every platform at the beginning. Start with reliable data sources that answer your most important questions.
Step 3: Select a Dashboard Tool
Google Looker Studio: Useful for building visual reports from supported data sources and combining different views of performance.
Google Search Console: A practical starting point for monitoring your website’s Google Search performance directly.
SEO research platforms: Tools such as SpyFu can help investigate competitor keywords and estimated search visibility. See our guide to SpyFu competitor keyword research.
Spreadsheets: Google Sheets or Excel can work well for simple monthly comparisons, action lists, and smaller websites.
Choose a tool that suits your reporting needs and available budget. A complicated dashboard is not necessarily more useful than a straightforward one.
Step 4: Organize the Dashboard
A practical layout can contain four sections.
Performance overview: Organic clicks, impressions, sessions, and relevant conversions.
Search visibility: Important queries, CTR, average position, and keyword trends.
Landing pages: Pages gaining or losing visibility, traffic, or conversions.
Recommended actions: Findings, next steps, responsible people, and review dates.
Place the most important metrics near the top. Detailed tables can sit below the overview for readers who need additional information.
Step 5: Compare Consistent Reporting Periods
Compare equivalent periods, such as one complete month against the previous month or the same month in the prior year.
Seasonality, reporting delays, tracking changes, and website updates can affect the results. Record important events so that future comparisons have context.
Avoid making major decisions based on one unusual day or a small short-term fluctuation.
Step 6: Turn Findings Into Actions
Every significant observation should lead to an investigation or a decision.
For example, if a page receives more impressions but fewer clicks, review the queries generating those impressions, the page’s average position, and the search results competing for attention.
Do not automatically rewrite the title or change the content until you understand the pattern.
Example: Reading an SEO Dashboard
The following fictional example shows how different metrics can tell a more complete story.
| Metric | Previous month | Current month |
|---|---|---|
| Search impressions | 20,000 | 26,000 |
| Search clicks | 600 | 650 |
| CTR | 3.0% | 2.5% |
| Organic sessions | 720 | 780 |
Impressions, clicks, and sessions increased, but CTR declined. This may indicate that the website gained visibility for additional searches without receiving a proportional increase in clicks.
The next step is to investigate which pages and queries contributed to the change. Check average positions and search intent, and confirm that the reporting periods and tracking setup are comparable.
These figures are illustrative, not results from a real website.
Common SEO Dashboard Reporting Mistakes
Tracking Too Many Metrics
Including every available measurement can make important trends difficult to see. Start with a small set of KPIs and add secondary metrics only when they support a useful decision.
Mixing Data Sources Without Context
Search Console clicks, Analytics sessions, and third-party traffic estimates are different measurements. Label each source and avoid treating the totals as directly equivalent.
Ignoring Search Intent
A page may receive additional impressions without attracting the right audience. Examine the queries behind its visibility before deciding whether the content needs improvement.
Reporting Numbers Without Recommendations
A list of metrics does not explain what the business should do. Summarize important changes and identify the next investigation or action.
Treating Rankings as Business Results
Rankings can help measure visibility, but they do not prove that visitors become customers. Include meaningful conversion data when business outcomes matter.
How Often Should You Review an SEO Dashboard?
For many smaller websites, a weekly check of important changes and a detailed monthly review provide a manageable routine.
Websites undergoing migrations, major content changes, or active campaigns may need more frequent monitoring. Technical issues and broken conversion tracking should be investigated when discovered rather than waiting for the next scheduled report.
The ideal frequency depends on how quickly your team needs to respond to changes.
Frequently Asked Questions
What should an SEO dashboard report include?
A basic report can include clicks, impressions, CTR, average position, organic sessions, landing-page performance, and relevant conversions. Add technical or backlink indicators when they support your objectives.
Can I create an SEO dashboard for free?
Yes. Google Search Console and Google Analytics 4 provide useful first-party data, while Looker Studio can be used to build visual reports. Available integrations and setup requirements vary.
Is an SEO dashboard the same as an SEO audit?
No. A dashboard monitors selected metrics and trends. An SEO audit investigates technical setup, indexing, content, and other factors in greater depth.
Which SEO metrics matter most to a small business?
Start with relevant organic traffic, visibility for important searches, and meaningful actions such as qualified leads, bookings, or sales. Select the metrics that match the business model.
Conclusion
An effective SEO dashboard report makes search performance easier to understand and act on. Start with reliable data, select metrics that match your goals, compare consistent periods, and explain significant changes clearly.
The goal is not to display the largest amount of data. It is to identify what is happening, investigate why it may be happening, and choose the next action based on evidence.


